Electromagnetic Spectrum

Diagram of the electromagnetic spectrum showing energy, wavelength, and light regions, including gamma rays, X-rays, ultraviolet, infrared, visible light, and radio waves. The infrared region is highlighted, with the Near Infrared Region (750-2500 nm) indicated.

Mitochondria Absorb Specific Narrow Bands of Photons in Visible Red and NIR

3D illustration of mitochondria with colorful background, showing a close-up view of a mitochondrion structure and an overlay of an energy graph below.

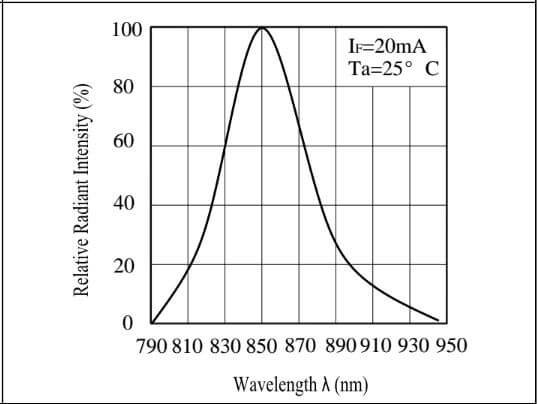
Narrow Band NIR Photon Emitter

Graph showing relative radiant intensity vs. wavelength, peaking around 850 nm, with conditions Ir=20mA and Ta=25°C.

Cytochrome C of the Electron Transport Chain is a Chromophore of NIR

Diagram of the electron transport chain showing protein complexes I, II, III, and IV in the inner mitochondrial membrane. Arrows indicate the movement of electrons and protons (H+). NADH and FADH2 donate electrons, and water (H2O) is formed as a byproduct. The intermembrane space and mitochondrial matrix are labeled.

Mito Photon™ Illuminator FAQ

  • The Mito Photon™ Illuminator is a tissue treatment device designed by Dr. Jeff Clark. It is not currently available for resale. Dr. Clark provides treatments using prototype devices he himself has made.

    Each device has two multi-positional heads that utilize arrays of near infrared leds to illuminate. Each head illuminates 51 square centimeters delivering 1.68 Joules of photon energy per square centimeter per minute.

    NIR photon delivery from the Mito Photon™ Illuminator is within a narrow band ranging from 800 to 850nm.

  • Description text goes here
  • Item description